Using the Datadog Extension
NeatContext ships a built-in Datadog connector with one read-only tool: log search. Your connected AI client can pull matching log events — timestamp, status, service, host, message, tags — while investigating an incident, using the same query syntax you'd type into the Datadog Log Explorer. It connects with your Datadog API and application keys, and it can only read logs: it never writes anything to your Datadog account.
This guide walks through getting the keys, connecting, and searching logs from your AI client, step by step.
Prerequisites
- NeatContext installed, and a supported AI client installed and signed in (see Getting Started). NeatContext brings no model.
- A Datadog account with logs in it, and permission to create an application key.
Step 1 — Get your two keys from Datadog
Datadog authenticates API access with a pair of keys; the extension needs both:
- API key — in Datadog, go to Organization Settings → API Keys (avatar menu, bottom left). Use an existing key or create one.
- Application key — go to Organization Settings → Application Keys
and create one. The application key acts as you, with your permissions —
it (or your user) must have the
logs_read_datapermission. If your organization scopes application keys, include at leastlogs_read_data.
Also note which Datadog site your organization is on — it's the domain you open Datadog at:
| You log in at | Your site is |
|---|---|
app.datadoghq.com | datadoghq.com (the default) |
app.datadoghq.eu | datadoghq.eu |
us3.datadoghq.com | us3.datadoghq.com |
us5.datadoghq.com | us5.datadoghq.com |
ap1.datadoghq.com | ap1.datadoghq.com |
Step 2 — Connect on the Extensions page
Open the Extensions page. Datadog ships bundled, so its card is already there, marked Built-in — nothing to add or install. Make sure it is enabled (and select it into the Context you'll connect), then fill the inline form:
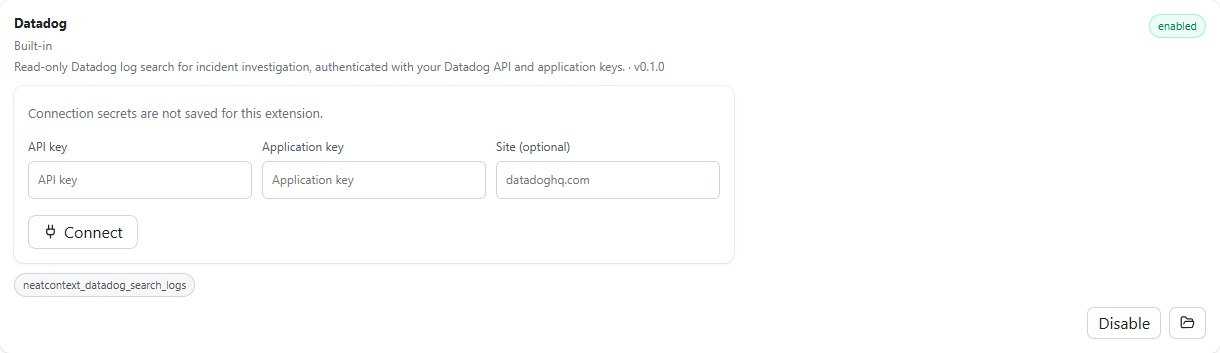
- API key — paste the API key from Step 1.
- Application key — paste the application key from Step 1.
- Site — leave empty if you're on
datadoghq.com; otherwise enter your site from the table above (e.g.datadoghq.eu). - Click Connect.
The keys are encrypted with your OS secure storage, stay on your machine, and are handed to the extension only at the moment a tool runs.
If the site doesn't match where your organization lives, Datadog rejects the keys as if they were invalid. When a connection that "should work" is denied, check the site first.
Step 3 — Search logs from chat
In any chat, ask a question the logs can answer. The model calls
neatcontext_datadog_search_logs with a Datadog log search query — the
same syntax as the Log Explorer search bar — and you'll see the call as an
activity step above the answer.
Prompts to try:
Use NeatContext mcp server to search Datadog for errors from the payments service in the last 15 minutes.
What's the dominant failure?
Use NeatContext mcp server to show checkout-api logs with @http.status_code:500 over the last 2 hours,
oldest first. When did they start?
Use NeatContext mcp server to pull the last 50 error logs on host web-7 and summarize the distinct error
messages.
You can steer the query precisely — everything in your prompt maps onto the tool's inputs:
| You say | The tool uses |
|---|---|
| "errors from the payments service" | query: "service:payments status:error" — any Log Explorer query works, including facets like @http.status_code:500. * means all logs. |
| "in the last 2 hours" / "between 09:00 and 09:30 UTC" | from/to — relative (now-15m, now-2h) or ISO-8601 timestamps. Default: the last 15 minutes. |
| "the last 50 logs" | limit — 1 to 100 events per call (default 20). |
| "oldest first" | sort — newest first by default. |
"only the main index" | indexes — defaults to all log indexes. |
| "get the next page" | cursor — each result carries a next_cursor for pagination, so the model can keep fetching. |
Each returned event carries its timestamp, status, service, host, message (long messages are truncated at 2,000 characters), and tags — enough to spot the pattern and pivot the investigation.
As always in NeatContext, the log evidence lands inside your context: the Context's domain profile and its knowledge folders (runbooks, TSGs, postmortems) shape what the AI checks first and which actions it recommends. The Incident Analysis walkthrough shows that combination end-to-end.
Troubleshooting
- The answer says Datadog isn't connected — you asked before connecting. Connect Datadog on the Extensions page, then ask again.
- "Datadog denied access (status 401/403)" — the keys were rejected. In
order of likelihood: the site doesn't match your organization (see the
caution above), the application key lacks the
logs_read_datapermission, or a key was revoked. Fix in Datadog, then Disconnect and reconnect with the corrected values. - "Datadog rate-limited the log search" — you hit Datadog's API rate limit. Wait a moment and ask again; narrower queries and smaller limits help.
- No logs come back, but no error — the query matched nothing in the time range. Remember the default window is only the last 15 minutes; say "in the last 24 hours" (or give explicit times) to widen it.
Rotating or removing keys
Click Disconnect on the Datadog card to delete the stored keys from your machine. To rotate keys, disconnect and reconnect with the new pair.
Next
- Pair log search with incident tools: Using the PagerDuty Extension.
- See profiles + knowledge + tools working together: Incident Analysis walkthrough.
- Curious how it works? The extension is a reference implementation — click the folder icon on its card to read the source, and see API-Key Extensions to build your own.